By Stephen O'Meara
If you wanted to paint an optimistic picture for Dublin after Sunday's 14-point defeat to Galway, there were, on the surface, some not outrageously far-fetched arguments.
At half-time Dublin trailed by just three points, having been denied a legitimate goal for over-carrying, where the referee missed a quick tap on the hurley by Ben Quinn.
That, alone, should have earned them half-time parity. They had also missed two very scoreable frees and Niall McMorrow had missed a pointed effort he’d normally put over in his sleep.
From the time that Cian O’Callaghan was sent off in the 40th minute, all analysis of the game was turned on its head and you really couldn’t judge Dublin fairly on a 14-man performance, no more than you could gauge Galway. With a numerical advantage, Galway ran riot.
Maybe, if Quinn’s goal had been allowed to stand, maybe if Dublin hadn’t missed a few easy opportunities and maybe if they hadn’t had a man sent off early in the second half, they could have won. Could they?
Actually, our statistical analysis shows that as things were running, even by half-time, the writing was on the wall. In one key area, as we’ll see, Galway were significantly superior.
High Balls and Breaks
Interestingly, most of the key performance indicators put Dublin more or less on parity with Galway, or even slightly better off, in the first half, when they played 15 on 15.
For example, the high ball tally was more or less even. Each side took two uncontested high balls, while Dublin won six to five contested high balls, cleanly (or won on the ground by the initial competing player).
The breaks, on high balls not won cleanly, saw Dublin come out slightly on top at 15 won to 13 lost.
Dublin are better positioned to win the break
For example, when Tipperary beat Kilkenny last September, with most statistical analysis reading more or less evenly, Tipp had won over three times more high ball competed for than Kilkenny did. It was the clear statistical difference on the day. There was no such clear reading from Tullamore in this regard.
Frees Conceded
Another statistic which typically separates teams was that Galway actually conceded six frees whereas Dublin only conceded four in the first half, and seven to five by 40 minutes.
Unlike football where committing more fouls is often a positive statistic, showing an ability to foul at the right time, in hurling, conceding frees is almost always a disadvantage. Dublin had kept to two-thirds the tally of Galway by half-time.
None of Dublin’s first half fouls were for personal fouls inside 90 yards, a testament to defensive coaching standards.

Dublin resist the temptation to risk fouling
Zonal Defence Analysis
Interestingly, Dublin actually had 27 attacks to Galway’s 22 in the first half (measured by having possession in hand and facing the goal or running parallel to it in the opposition’s half, or having a free inside scoring distance in your own half).
Furthermore, in numerical and spatial terms, Dublin actually launched attacks in more ideal circumstances.
Dublin attacked 13 times into a man-on-man defence while Galway only did so 10 times, while Dublin created eight attacks by turning over Galway in their own half/earning a free from Galway possession inside scoring distance. Meanwhile, Galway only managed to turn Dublin over four times.
All things considered, on the surface, those figures alone should lead you to expect that Dublin would have scored significantly more in the first half. Yet they didn’t. Why was that?
Uncontested strike Analysis
With all other factors being even or in Dublin’s favour in the first half, one key figure read overwhelmingly in Galway’s favour.
Even with Dublin going in just three points down at the break, you got the sense that Galway’s scores seemed to be coming more easily than Dublin’s.
Our “Uncontested Strike Analysis” illustrates that this wasn’t mere perception.
An uncontested strike, chalked up when a player (not including the keeper) has time to plant their feet and strike, or strike with full field of vision and no risk of being hooked while running towards goal (essentially allowing a player on the ball pick out a target or pick off an easy score), saw Galway wallop Dublin.
In the first half, Galway earned the right to get off 29 such strikes while Dublin only managed 20. Interestingly, a minute before Dublin’s goal, that figure read 29 to 17, which was just five percent off being proportionate to the scoreline.
Dublin had tallied 58 percent of Galway’s uncontested strikes and 53 percent of their total score. By the time they’d scored the goal, they had tallied 69 percent of Galway’s free strikes and 76 percent of their total score.

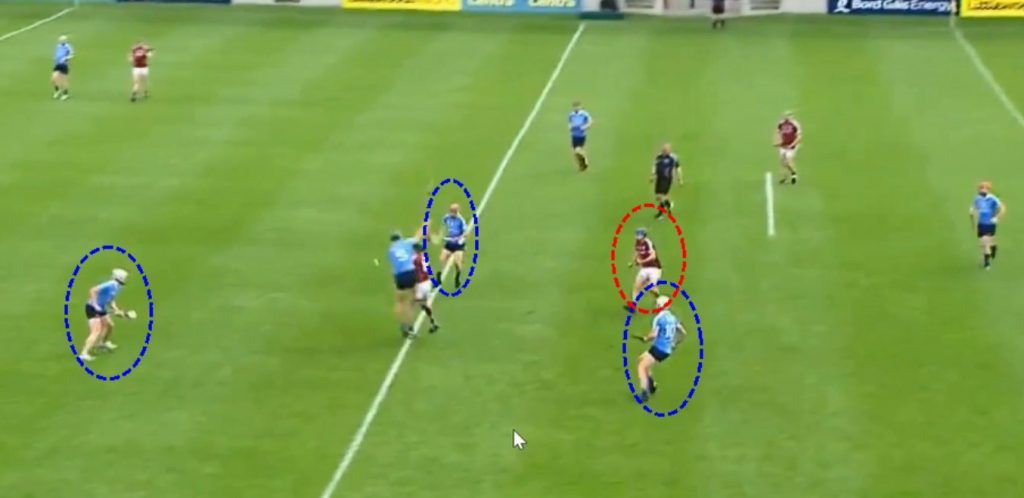
Galway resist the temptation to go long

They cut inside

And hand to the free runner to score
More Zonal Defence Analysis
Quite simply, this meant that while Galway had less attacks, and spatially and numerically less favourable attacks, the dynamics surrounding their attacks were still far more favourable.
Whereas Dublin’s forwards frequently had to take the ball whatever way it came at them, Galway’s forwards more frequently had the ball played into them by a player who had the time to look up and pick out their man.
This would largely account for why Galway would score 1-4 from 10 man-on-man attacks (a seventy percent score ratio), while Dublin would score 1-3 from 13 (a 46 percent score ratio), and why they’d score three points from eight attacks into a blanket defence (a 38 percent ratio), while Dublin would score one point from six (a 17 percent ratio).
All the while, Galway managed three points from four turnovers high up the field, a 75 percent score ratio, and Dublin managed just one from eight turnovers, a 12 percent score ratio.
Puck-out Analysis
Interestingly, contrary to a stated perception, Dublin weren’t cleaned out on puck-outs in the first half. They lost nine out of 16 of their own long puck-outs in the first half while they won six of Galway’s 11, coming in at a total of 13 to 14 won/lost.
Once again, however, owing to the aforementioned figures, Galway turned four of the nine they won on Dublin’s long puck-outs into points and three out of two of their own, 44 and 67 percent ratios respectively.
https://twitter.com/SportsJOEdotie/status/868904493513101312
Dublin, on the other hand, scored just one point from the seven of their own long puck-outs won, and just one from the six of Galway’s long ones which they won, 14 and 18 percent ratios respectively.
This tallies less than half of Galway’s puck-out to score ratio on the side’s own long puck-outs won, and not far off one-third on the opposition’s long puck-outs won.
Interestingly, Galway manoeuvred a point from one of two first half puck-outs they hit to the full-back line, while Dublin’s three attempted pucks to the defence in the first half resulted in no scores gained and one point conceded.
Second half
The first five minutes of the second half, before O’Callaghan was sent off, essentially illustrated what Galway were potentially on the edge of doing all afternoon, based on our figures.
As opposed to breaking generally even or coming off slightly worse on a number of “direct combat” figures, they actually lorded them in these five minutes.
As opposed to losing an 87/100 ratio on high, contested catches in the first half, they would win three from three early in the second half, and a fourth uncontested.
This would allow them four uncontested strikes to Dublin’s two in this five-minute period. Considering the significance of the other figures, this aerial dominance was enough to allow them to thoroughly dominate the early second half.
They scored four points to zero in the opening five minutes (including the free converted after O’Callaghan was sent off).
From this point, a man up, figures from the final 30 minutes were incidental.
Conclusion
In short, even before O’Callaghan’s sending off, the key difference was Galway’s ability to find spare men, particularly in their half-back line.
On the whole, strategically, you couldn’t say that Dublin were particularly far off Galway in the first half. They simply lacked either the adventure or the raw ability to weave through tight spaces like Galway and manoeuvre situations whereby they could find spare men.
While this can be a tactical element, with extra bodies in and around the half-back line, for the most part, this wasn’t the case. Galway simply appeared to have more raw ability in terms of the capacity to step inside opponents and lay the hand-pass off.
Equally significantly, it was also testament to the ferocious pressure Galway exerted on Dublin in the middle third, and even in Dublin’s full-back line.

Liam Rushe appears to have time

But is put under pressure

As is the next man up
Things were also helped in no small part by the amount of space that Joe Canning created up front by roaming here, there and everywhere, and the kind of ball he, and others, played in when the space was created.
All in all, a good day’s work for Galway, but still none the wiser as to how you could expect they’d fare come August.
As for Dublin, with a general structure that alludes to a good all round tactical set-up, with the players currently in Ger Cunningham’s panel, statistical analysis of Sunday's game, at 15 versus 15, suggests that they probably performed not far off as well as they have the technical capacity to do.


